Buses, trains and time: what’s really REALLY happening
Are our buses and trains more on time and reliable, less so, or just different? It’s been much too hard to tell from official information. But rejoice: it’s public-spirited transport nerds to the rescue again!
Talk Wellington is proud to bring you the real oil (information that GWRC should really be bringing you), courtesy of stalwart Wellington transport nerd Mike Mellor.
The big conclusions are followed by the analysis behind the figures, all sent to all relevant decision-makers and caveated with “I hope I’m wrong and please correct me”. As we publish this, Mike advises that no corrections have been made.
The big conclusions
1. Data
Metlink’s website (the source of most of the data) says “How do we know things are getting better – your feedback and we have been monitoring the 10 most used services in Wellington city.” I don’t know about the customer feedback, but it is clear to anyone monitoring the data that GWRC has produced for the 10 most-used services (two of which are not actually in Wellington city) that things are not getting better.
To the best of my knowledge,GWRC has published no data or other objective information that shows any improving trend in either bus or train performance.
2. Performance
What’s measured?
Punctuality – this measures whether a bus leaves its origin less than one minute early or five minutes late, but doesn’t include any late running en route. For trains it means they run within five minutes of time.
Reliability – this measures whether a bus actually ran
Looking at performance in more detail, of the two bus KPIs:
- reliability has touched target just twice
- punctuality is well below levels that are targeted in Auckland, and achieved there by the same companies as in Wellington
and
- punctuality is well below target
- no reliability figures have been published
According to GWRC data, buses are consistently less reliable than target levels, with punctuality consistently well below the levels achieved by the same operators in Auckland.
Trains are consistently much less punctual than target; no data on train reliability, a topic of widespread concern, has been published.
3. Bus priority
It is widely recognised that bus priority is essential for the operation of the new network, but to the best of my knowledge GWRC produced no formal bus priority proposals between the new network’s design in 2014 and its implementation in 2018.
So it is good to see that this is now on the agenda, and GWRC needs to sit down with all three main operators and WCC to work out what’s needed – and fast. This issue has been around much longer than LGWM, and that cannot be used as an excuse for continuing inaction. Whatever is in the Recommended Programme of Investment, bus priority must surely be there.
4. Responsibility
It is depressing and rather pathetic to see GWRC continuing to blame others for its own own failings (most recently with the Airport Flyer debacle, entirely the result of the GWRC decision to exclude exempt services from the Metlink network). This is clearly a less-than-effective strategy, and a complete distraction from the real issues.
Minister Twyford (to whom I have copied the original email on which this post is based) is quoted in the Dominion Post as saying “Actually, Greater Wellington needs to get their act together. It’s their responsibility”. As Mayor Lester says, “GW has to do it”.
5. Benchmarking
To enable it to evaluate its performance fully, GWRC needs to be benchmarking itself against others, such as Auckland Transport: my initial efforts show that this could be salutary.
To the best of my knowledge, Wellington has fallen behind Auckland in every aspect of public transport.
The only exception is in the operation of electric buses, still absent from AT’s fleet, but even there Wellington has substantially reduced its lead.
Data analysis
Some notes about what you’ll read below
NZ Bus has been having some industrial issues, so italics on coloured background indicate where the data has been affected by this. Because these issues are outside of and do not affect the general trend, they have not been charted.
The absence of these figures from Greater Wellington Regional Council’s datasets, not published until over 8 weeks after the event and with no comment about these deficiencies, raises serious questions about the integrity of the data and fragility of the data-collection process.
Such data irregularities are of financial concern because of the potential for missed contractual penalties for which bus operators may be liable, and also because of the revenue implications of irregularities in Snapper data.
These issues need to be addressed.
1. Metlink performance and patronage to 10/3/2019
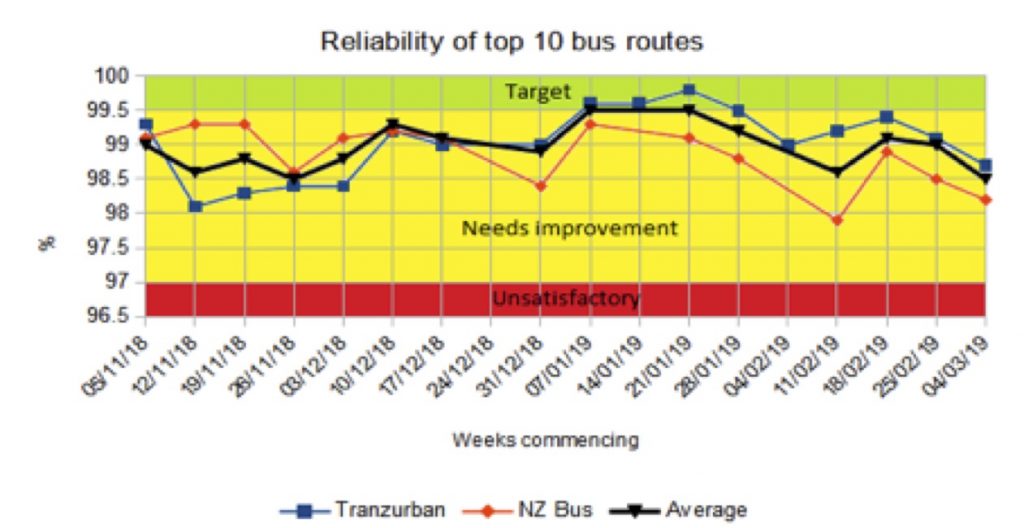
1.1 Average reliability for both operators has fallen for three weeks in a row, well below target and at equal-worst level since data has been published. All improvement initiatives have been ineffectual.
1.2. Tranzurban continues to outperform NZ Bus
2. Overall bus punctuality in Wellington – the best performers to 10 March
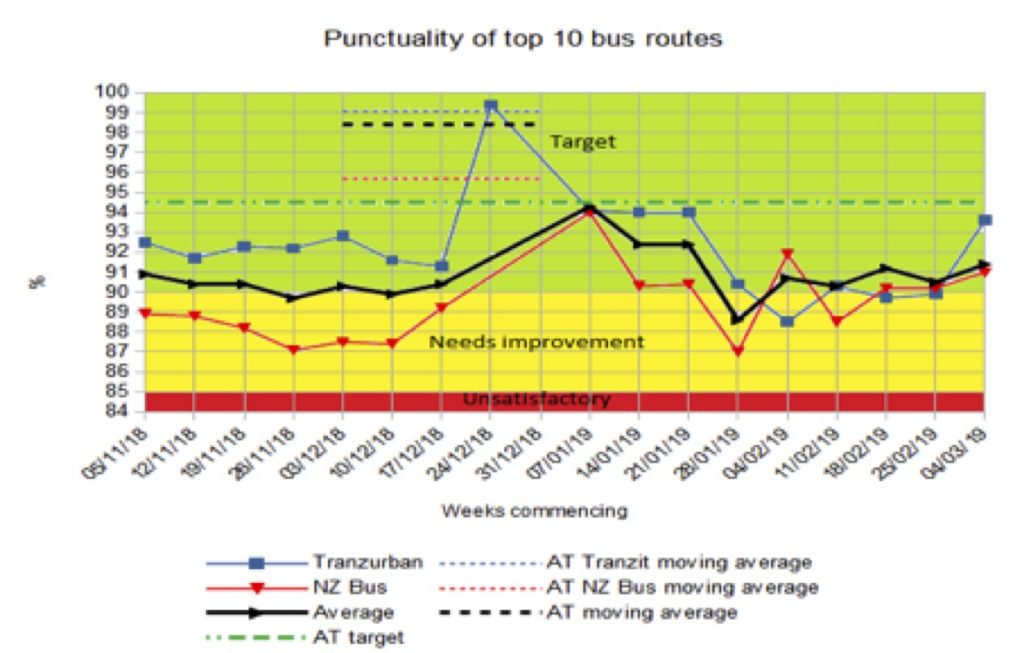
2.1 Average punctuality rose from the previous week, but improvement in the period that data has been published has been marginal.
2.2 Both operators continue to perform much worse in Wellington than they do in Auckland, where they consistently exceed a much more demanding target.
2.3 As the graph shows, there is no indication of any overall improvement in Wellington – all initiatives so far have been ineffectual.
3. Patronage
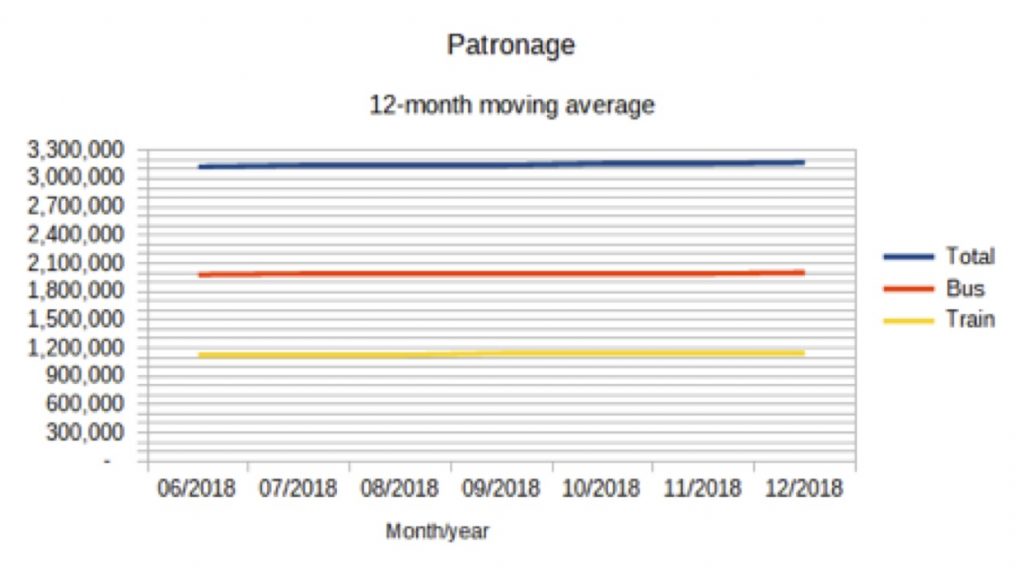
3.1 No new data is available – that’s no patronage data published for the whole of 2019.
4. Bus data
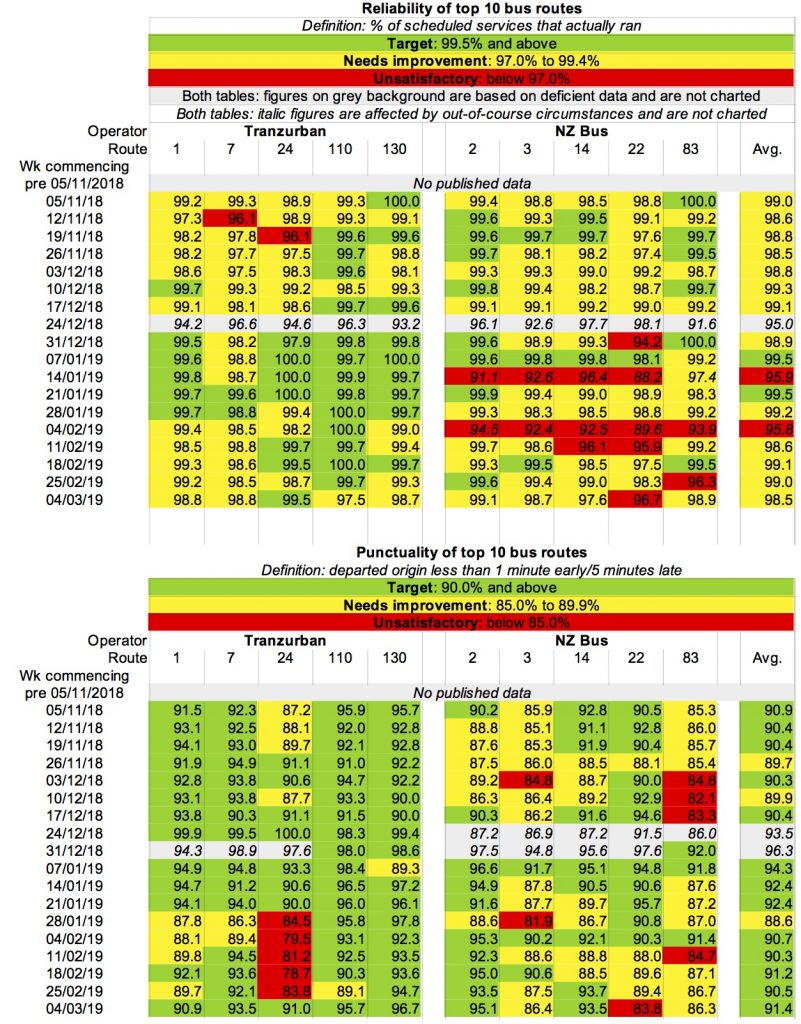
4.1 Notes on Bus data.
a) italics on grey background indicate where the published data is deficient: for Wed 19/12/18 and Thu 3/1/19 there is no punctuality data for routes 1, 2, 3, 7, 14, 22 or 24;
- for Wed 26/12/18 there is no data of any sort for any of the NZ Bus routes;
- for Thu 27/12/18 there is no reliability data for any of the routes.
These deficiencies make any derived figures such as averages of dubious value, and distort trends, so they are not charted.
6.Train punctuality
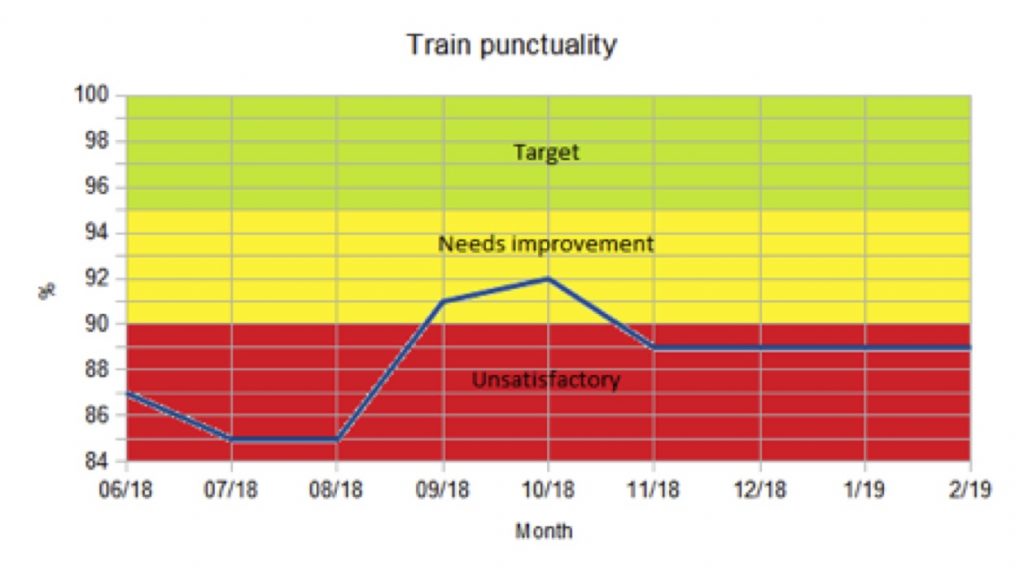
6.1 Train punctuality continues to be very poor.
6.2 Despite much public concern over train reliability, no relevant data has been published.
This is a real concern because trains are the backbone of the regional network, bringing thousands of commuters into Wellington’s CBD every day (17,000 into the city between 7 and 9am alone)
I’m a bus passenger, does this help me?
The above measures are of contractual performance, and from a passenger perspective they are necessary but very far from being sufficient.
In particular, the punctuality figures give no indication of how late buses are running en route (from observation, bus bunching is still common), nor the effect on scheduled connections.
A measure such as Excess Waiting Time, calculated from RTI/Snapper data, is essential for that.
Greater Wellington’s presentation of the data is pretty un-userfriendly, making it quite hard to analyse the data and identify the essential information about trends and comparisons.
GWRC applying elementary Open Data practices (as is common amongst transit agencies) would make such analysis much easier.
The performance of routes 1, 2, 7 and 22 is particularly important because they are scheduled to make connections, meaning that the effects of poor performance extend across the wider network. (Routes 21 and 30x are also important in this respect.)
So what should we think?
As I observed earlier in this piece, data, service performance, bus priority, organisational responsibility and benchmarking are all areas where GWRC could be making some elementary improvements to bring Wellington within cooee of the standard we can reasonably expect from a public transport provider.
Stay tuned for the report of yesterday’s Sustainable Transport Committee meeting where they discussed these issues.

Sources for these analyses:
- Bus data: https://www.metlink.org.nz/on-our-way/measuring-progress-on-improvements-to-the-bus-network/
- Train data: https://www.metlink.org.nz/customer-services/rail-performance/
- Patronage data: https://www.metlink.org.nz/assets/Uploads/P06-Dec-18-Patronage-Stats.xlsx
- Auckland data: https://at.govt.nz/media/1979039/item-10-open-business-report-for-11-december-2018final.pdf
Update: Twitter notifications of cancelled buses and trains are now reinstated, thanks to work by Dave Armstrong and Roger Blakeley
Thankyou. This resonates with daily experience. And yet we continue to see positive press releases from GWRC like the one in Scoop where Barbara Donaldson says patronage is up. Where is she getting her figures from? They feel disingenuous.