How dangerous is your street, really?
When it comes to what’s safe on the roads, our perceptions are often far from reality. If you’re keen for some solid data, you’re in luck…
“Main Street’s not that bad…”
Dangerous things we interact with every day often feel less dangerous than they really are (and extremely safe things that we do infrequently feel more dangerous). So where it comes to very familiar things – local streets and roads – it’s always good to have some real data.
CAS – the Crash Analysis System – is a database of vehicle crashes that people have reported to the Police, all mapped by where they happened. It’s pretty simple, and it’s super interesting!
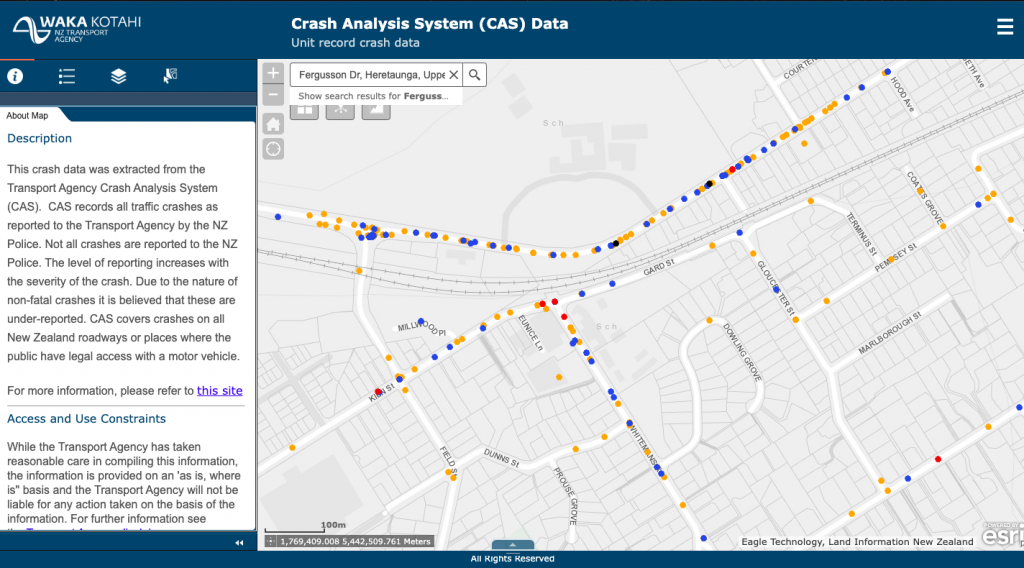
It’s also far from a complete picture. For example, a huge proportion of near misses don’t get reported at all, even though it’s sheer luck that no-one got badly injured or killed. And because it relies on people reporting the crash to the government – the Police, Waka Kotahi – there’s a big skew there: if you don’t have much faith in The System, you’re likelier not to bother reporting something you see that’s bad but not horrific.
But with those caveats in mind, CAS is still a fascinating look.
It’s more than just idly interesting
CAS is very important: your council and Waka Kotahi use it to decide which roads and streets are dangerous and deserve priority for fixing. Where the fixes might be expensive or time-consuming (or just disruptive for traffic), there’s often pressure not to prioritise.
Look up some streets and roads you know!
How well does the CAS picture match with how locals see the street – like how safe it is for walking or biking, or – for that matter – for driving?
Why do you think that is?
Image credit: Zizi Sparks, Fairfax-NZ
Leave a comment