How do we get around? Some data, statistics and facts
As we wait for Let’s Get Wellington Moving’s announcement of how 4 billion-odd of public dollars will be spent on Wellington transport, let’s check where we’re at…
Good public transport is important to how Wellington functions. But just how important is it?
We recently came across the ‘Wellington City CBD Corridor Survey’, which has been conducted annually by the GWRC and WCC since 2000. It’s used in the Let’s Get Wellington Moving business case, and is an example of some great data collection and cooperation between the city and regional councils. It’s been going since 2000 – if the Corridor Survey was a kid it could now vote and buy a drink!
This survey counts everyone crossing into Wellington City between 7am and 9am, with the boundary as defined by the red line below. (If you don’t cross this line during that time, you’re not counted in this survey.)
They’ve estimated average vehicle occupancy, and this is multiplied against measured vehicle volumes to obtain a total “vehicle person trips” number.
Bus and rail passengers and vehicles are counted on specific days, while active modes are counted for a week and the numbers averaged.

City centre – cordon
The long-standing nature of the study gives us some great insights into how travel behaviour has changed over time.
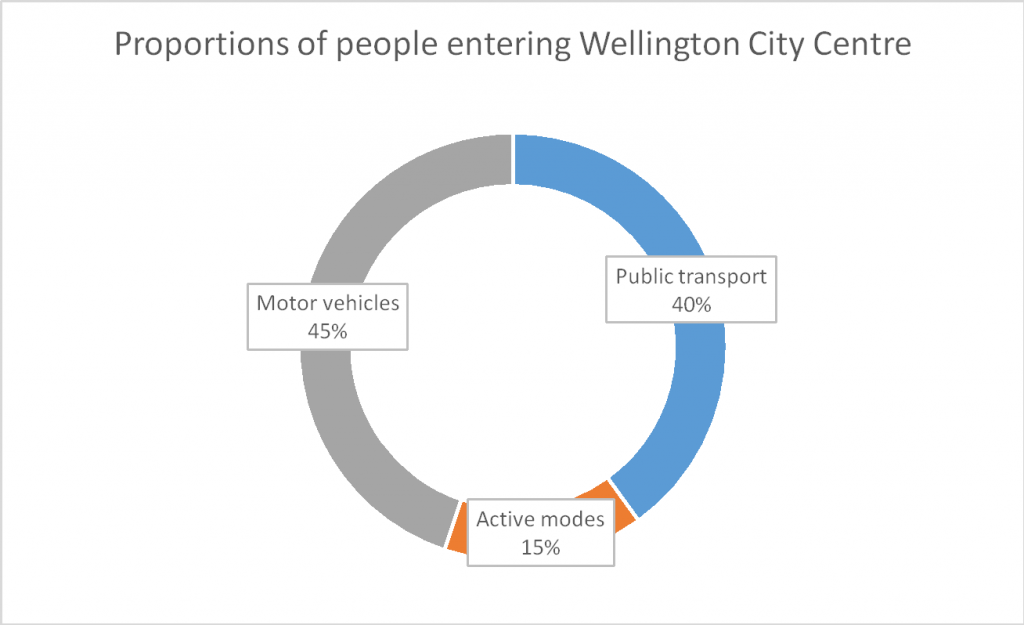
Firstly let’s have a look at the 2018 numbers.
Overall 75,100 people were recorded as arriving in Wellington City Centre during the two-hour morning peak.

Car drivers are the largest single access mode, with 20,000 cars entering Wellington City Centre in the morning peak.
However, they only account for 27% of people coming into Wellington.
Overall vehicles bring in 33,000 people, or 45% of the total. Trains bring in nearly 17,000 people (23%), and buses nearly 13,000 (17%).
These numbers are summarised below.
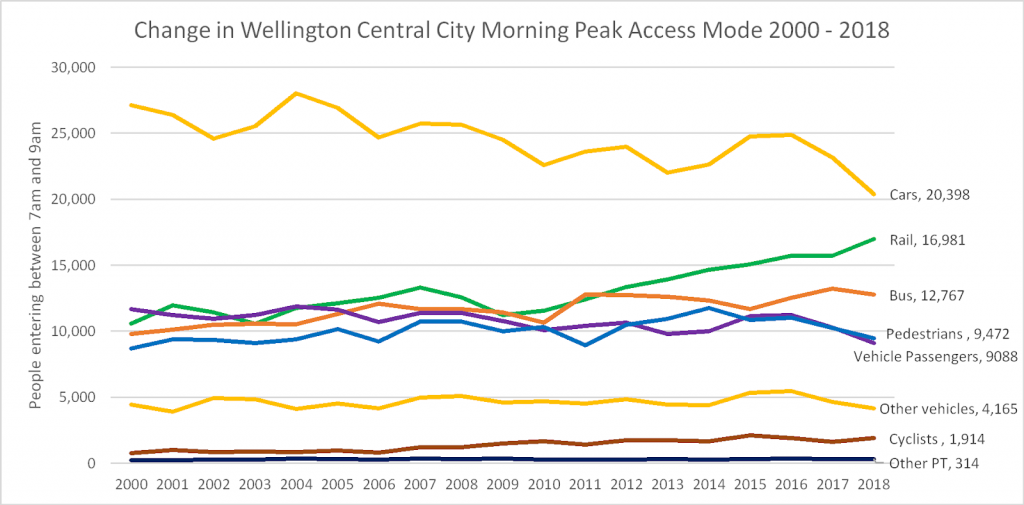
Now let’s have a look at how these trends have changed over times.
This is what the changes by mode look like. Interestingly many modes have stayed relatively constant.
What stands out is the steady decrease in private car trips and major growth in rail patronage in the last decade.
Car trips have dropped from 27,000 to 20,000 since the year 2000. Meanwhile rail has grown from 11,237 in 2009 to 16,981 in 2018, an impressive 51% increase. All this on the back of some fairly basic upgrades and minimal service improvements (insert snide, sarcastic comment yourselves, dear readers).
The table below shows the summary of changes since the year 2000. Private vehicle access has dropped from 60% of total trips to 45%, and the combination of public transport and active modes has risen from 40% to 55%.
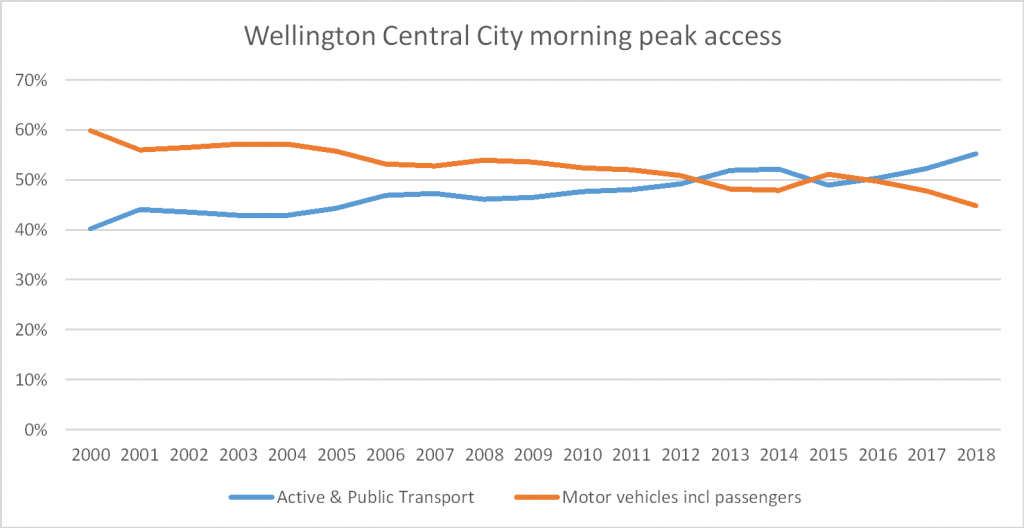
This is great news.
It shows things in Wellington have been heading in the right direction, and proves Wellingtonians can shift the way they move around the city.
As mentioned in an earlier post, this is despite fairly low levels of investment in train services, focused on catch-up maintenance and minor service upgrades.
Almost all of this change has been led by large growth in rail patronage. Bus patronage has remained fairly flat (we’ll have some stats soon about bus performance post #bustastrophe.)
This bodes well for further investment that shifts the balance of movement in the city towards public and active transport modes. Fingers crossed Let’s Get Wellington Moving puts that investment in the right things.
What’s changed for you over the last decade?
Have you shifted from car to bus or train?
Or from public transport to driving, or another combo? Why?
Let us know in the comments below.
And note Councillor Andy Foster’s comment in the original post (he’s former chair of Wellington City Council’s transport and infrastructure committee):
Thank you for the very good article. We are heading in the right direction – and you could have taken that trend back further – to 1991/2 when PT use stopped declining and started increasing – a lot of that was bus. Likewise walking also increasing – put part of that down to densification rather than sprawl.
One thing that make this trend even more positive is that it excludes the people who live (and generally work) inside the cordon – and that growth has been spectacular. From the last census about 84% of those people walk to work.
The other is the increase in cycling – the numbers are small relative to car/PT/walking – but the proportionate growth has been significant.
Finally it isn’t fair to say that rail has had only basic upgrades and minimal service improvements – though you do say that there has been catch up on deferred maintenance ! It is just that the deferral was something like 60 years. Clearly there is a better quality of service, plus some improvements in scheduling – express services etc, and a more reliable network.
Anyway – thank you again for an excellent article.Kind regards
Andy Foster
City Councillor
Interesting further reading
- Read more about the survey here [2.5MB PDF]
- How does this compare to other towns? Cool colourful maps of Auckland’s situation here [4 MB PDF], and some interesting insights into “getting to the centre” including Christchurch here
Picture Credits
Banner image by Stuff.co.nz
I am now cycling after changes to the no.30 bus made it a not-very-express service from the miramar peninsula.
Problem is, I am still nervous after being taken out by a truck while commuting by bike 18months ago. Parts of the waterfront are ok for bikes but the CBD is just scary!
We need safe alternatives to the car. Especially as bustastrophe shifted so many people away from the buses.