Buses, trains and time: what’s really happening (31 March report)
The latest report on public transport performance, compiled from Metlink’s own (scarce) data by stalwart transport nerd Mike Mellor. Data to 31 March.
Editor’s note: We’re still observing – (along with well-regarded local commentators like Dave Armstrong, and our own commenters) – a mismatch between public statements of how things are OK or getting better, and the actual data. They want to know your thoughts, though! Send your feedback.
A reminder of the principles behind this report: it tracks performance over time of the top 10 bus routes and of trains, on average and by operator, as published weekly / monthly / irregularly by GWRC, against GWRC’s KPIs, showing trends and whether performance is on Target, Needs improvement or is Unsatisfactory. Whether the KPIs are appropriate is a matter of opinion: this report is concerned solely with matters of fact.
1. Bus Reliability

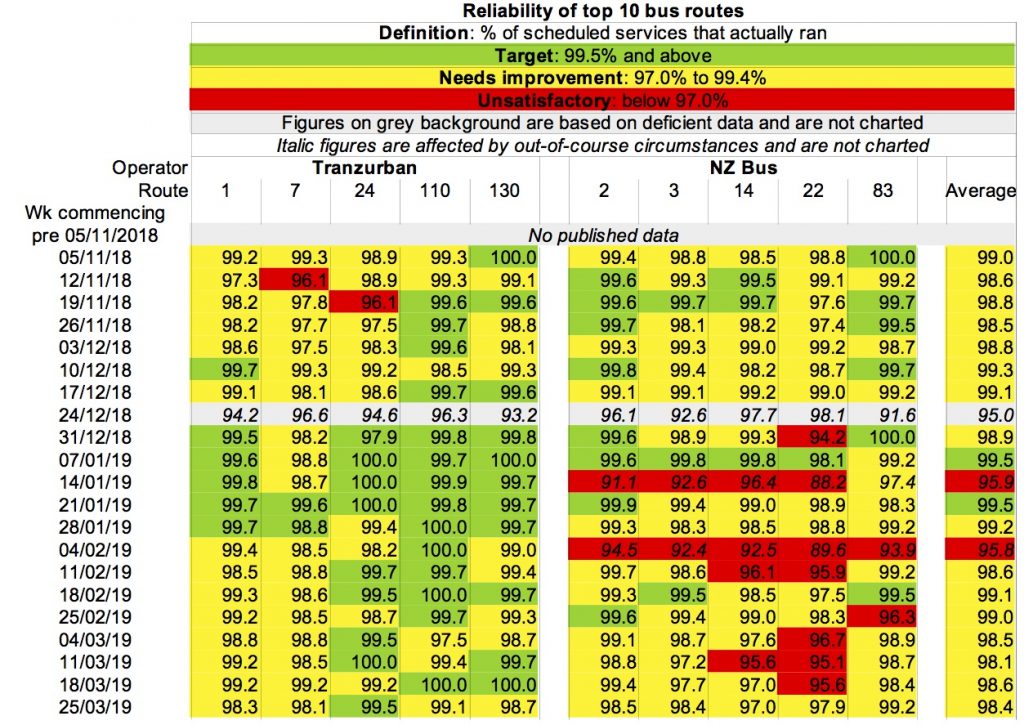
1.1. Average performance declined, driven by a worsening in Tranzurban performance but an improvement from NZ Bus. Despite all the cancellations, overall performance on none of the top 10 routes this week is regarded by GWRC as Unsatisfactory.
1.2. Tranzurban continues to outperform NZ Bus.
1.3. NZ Bus performance has always been in the “Needs improvement” area, but no improvement has been delivered – driver shortages are just the most recent manifestation. This is a continuing failure on the part of both GWRC and NZ Bus.
2. Bus punctuality

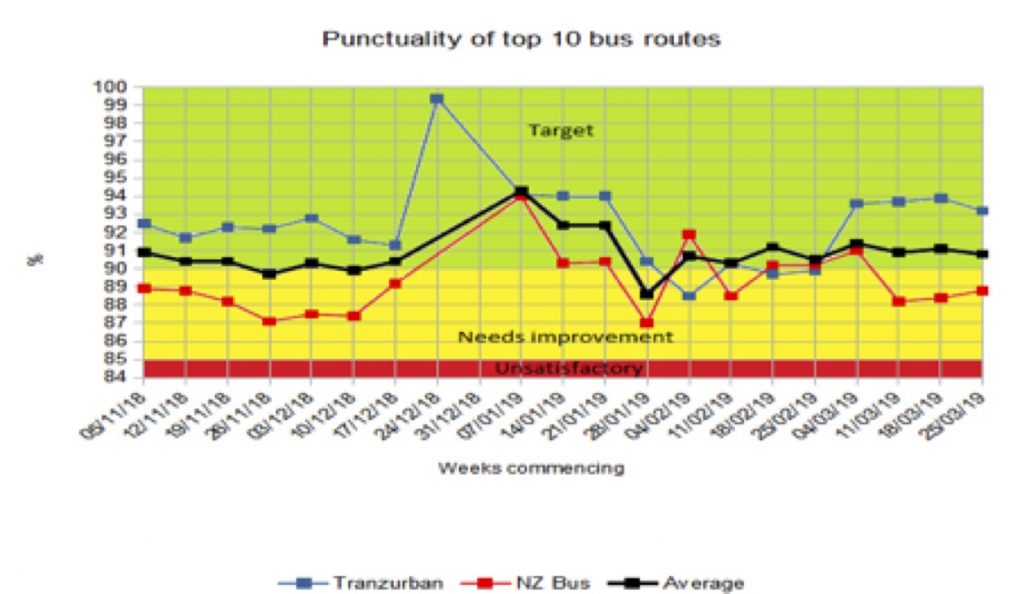
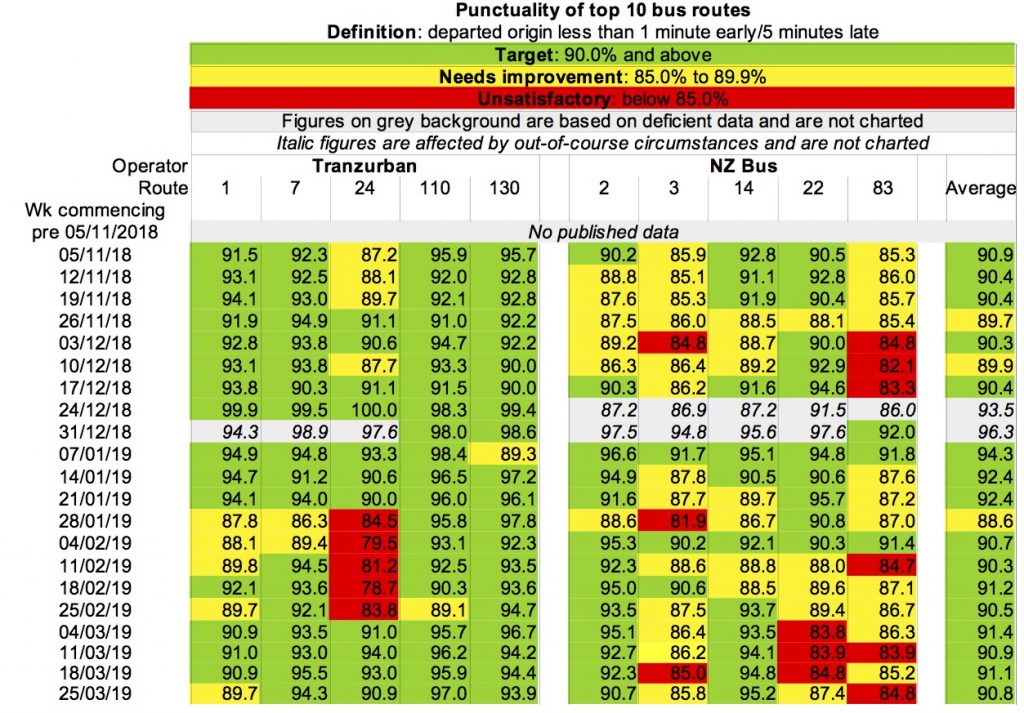
2.1 No significant changes, with NZ Bus still needing improvement: Average punctuality is still at the same level as it was when this dataset commenced last November. All initiatives to improve performance have been ineffectual.
3. Train reliability
3.1 No new data has been published, and no initiatives to improve the Unsatisfactory performance announced.
4. Train punctuality
4.1 No new data has been published, and no initiatives to improve the Unsatisfactory performance announced.
5. Patronage
5.1 No data covering 2019 has been published.
6. Bus Data


Data sources:
- Bus data: https://www.metlink.org.nz/on-our-way/measuring-progress-on-improvements-to-the-bus-network/
- Train data: https://www.metlink.org.nz/customer-services/rail-performance/
Read Mike’s earlier reports on Talk Wellington:
March 5
March 21
March 27
Banner image credit: Twitter user Merxplat
The data must meaningless about useage and trends re who is still using the buses. Our household has gone back to cars after wasting months with late or cancelled buses. But the main reason for us and many more in Northland and Wilton getting back in our cars is the route. Making us catch 2 buses for such a short journey doubles the journey. It use to take 15 minutes on the 13 route and 25 minutes on the 22 route. It’s now 25 minutes on the 13 and 45 to 50 minutes on the 22. Assuming they are on time. It’s now quicker for us to catch a Karori bus and walk to Northland from the tunnel. GWRC have destroyed our bus service. We can not longer catch 1 bus into the city or across it as the 22 and 13 buses no longer travel through the city and the 23 was cancelled. Cars now clog the city end of Northland as people park closer to walk to the Karori tunnel to pick up a karori bus as it’s at least one bus into the city. People have changed their travel patterns. This is a common story but isn’t reflected in the data.